In 2018-19, Rob Delsing and Tom Luyten organised a minor, stimulating media design students to create interactive media installations, based on data-driven algorythms.
Would that be obtainable by the students? How diverse would the resulting installations be? What kind of software skills would be needed?
These are the resulting projects:
THE DAILY DATA DUMP Data consumption
Daily choices we make have and effect on the climate system around us. Unfortunately, these effects are only visible on a large scale and longer periods of time. This might give the appearance that our actions are not connected to the larger system. Messages of increased global temperature or the extinction rate of animals might seem unconnected to our own actions.
These systems, however, are more connected than we realise. Food production, for example, is one of the main causes of negative climate change.
Build an interactive museum installation that educates people on the topic of food consumption and its relation to global climate change.
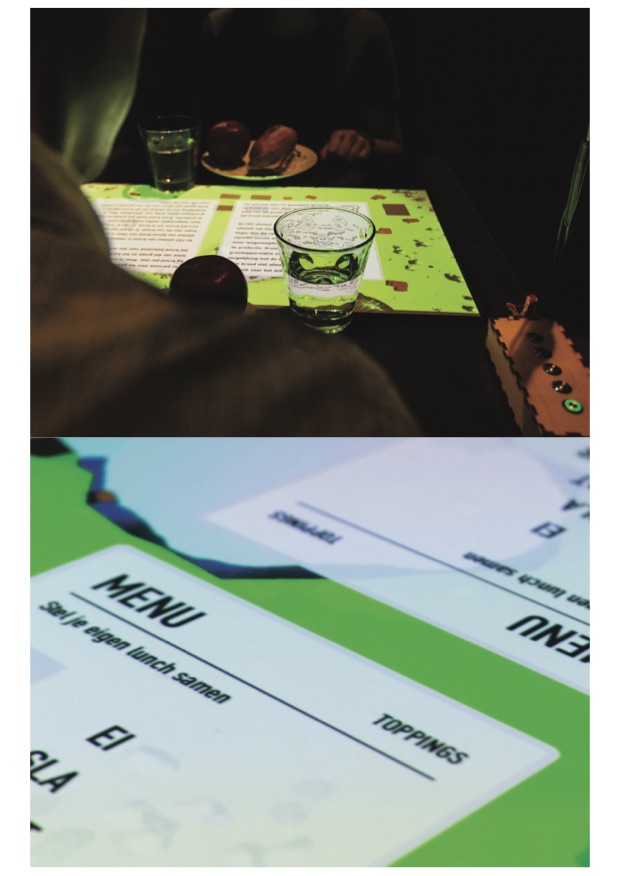
VIEW is an interactive installation that can be installed in any restaurant. By projecting on top of the menu and table, it creates a novel and interactive experience that surprises the unsuspecting restaurant visitor.
While ordering their food, the visitors can see a whole ecosystem changing based on their food choices.
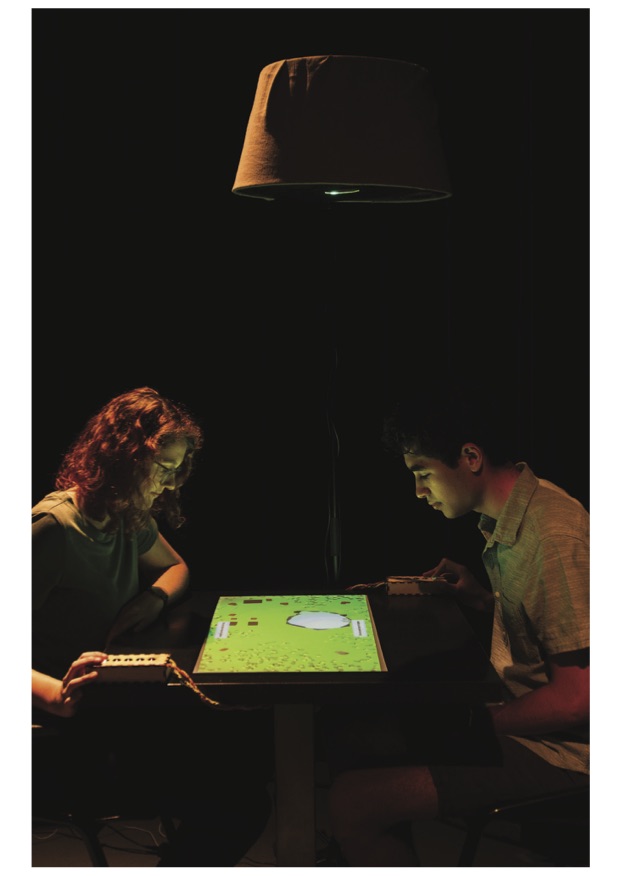
By altering their choices and experimenting with cause and effect, they can learn how their actions and choices impact the complex ecosystem that’s projected in front of them.
The installations consists of a beamer mounted above a restaurant table and two little boxes on each side of the table mounted with illuminated buttons. Using these buttons, the visitors can navigate the experience and influence the projected system in front of them.
A mini computer, mounted beneath the table, controls the whole experience. The interface boxes are built with an Arduino microcontroller.

concept and installation were created by:
Jiska Adriaens
Nina Bisscheroux
Danique Dohmen
Djamal Tehubijuluw
Communication & Multimedia Design students of the Arts Faculty Maastricht.
What if? What if we would share more? Could this tiny alteration of our behaviour have an effect of the amount of CO2 we emit as a species ? In order to experience the way the whole climate system reacts to seemingly small changes such as a tendency to share, you need to be able to experiment with the different parameters and see their effects on the system as a whole.
Build an interactive museum installation that educates people on the topic of sharing and its relation to global climate change.
Sharing = caring is an interactive museum installations that enables visitors to explore the effects of sharing on CO2 emissions. It does so by focussing on 3 topics: sharing or owning a car, a drill and a dress. By using these everyday examples of household items that we all own, it delivers a message that’s close to home.
Sharing is caring is a table-top installation that can host 3 visitors. Projected on top of the table-top are scenarios in which the visitors need to make a choice. The choice always involves either sharing or buying an item.
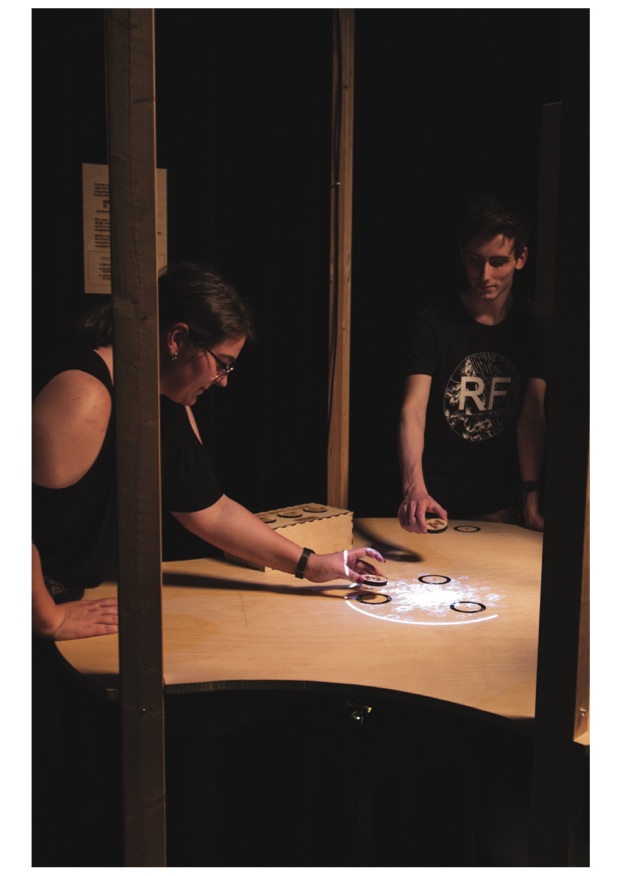
The effects of our own choices, as well as the cumulation of the choices of the other visitors, are directly visualized and displayed in the middle of the table. This enables the 3 visitors to experiment with cause and effect and it opens up room for negotiation. It might be OK for one of the 3 visitors to own something, if the other share, for example. Opening the dialog about ownership and sharing things, and the absurdity of everyone owning the same things while rarely using them is the main objective of this experience.
Sharing=caring consists of a table, a projector, some wooden “pucks”, a computer and an Arduino microcontroller. All visual elements are projected by the beamer on top of the table. By placing the wooden pucks on certain areas of the table, visitors can make choice between sharing or owning a product. A central computer, mounted beneath the table, controls all the processes and (re)calculates the animations. An Arduino microcontroller checks if pucks are placed in a certain slot, and communicates this choice to the main computer.
The Sharing
concept and installation were created by:
Marika Patsa
Rob Dormans
Sven Vossen
Mike van Engelen
Communication & Multimedia Design students of the Arts Faculty Maastricht.
All project are part of the minor Interactive Media Installation Design 2018-19 by Rob Delsing and Tom Luyten for MAMDT Zuyd University
With the support of the research group TechnologyDrivenArt.org
©2019
Would that be obtainable by the students? How diverse would the resulting installations be? What kind of software skills would be needed?
These are the resulting projects:
Project 1
THE DAILY DATA DUMP Data consumption
Introduction
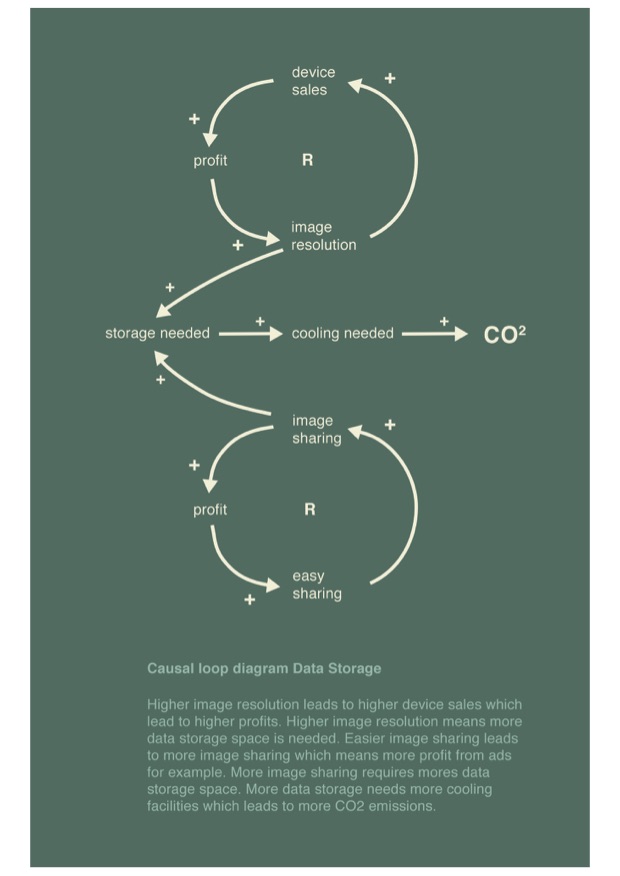
You wake up to the red light of Netflix that illuminates your room. You fell asleep. You take out your phone to check the departure time of your train and send an “out-of-bed” selfie to your friend. While you get out of bed, you select a song on Spotify to start your day… All these small digital acts have an impact on the climate. We produce and consume growing streams of data, that need to be processed and saved in ever-expanding data centers around the world. These data centers produce massive amounts of heat and are cooled down by energy-consuming installations. CO2 emissions as a direct effect of consuming and producing are often unknown or overlooked.
Objective
Build an interactive museum installation that educates people on the topic of data consumption and its relation to CO2 emissions and global climate change.
The installation
Loops of animations are shown on screen of different devices (smartphone, tablet and computer). These loops represent the daily data consumption and production of a person (e.g. Google, Facebook and Netflix). Visitors can influence this stream of data by turning knobs that are mounted beneath the devices.
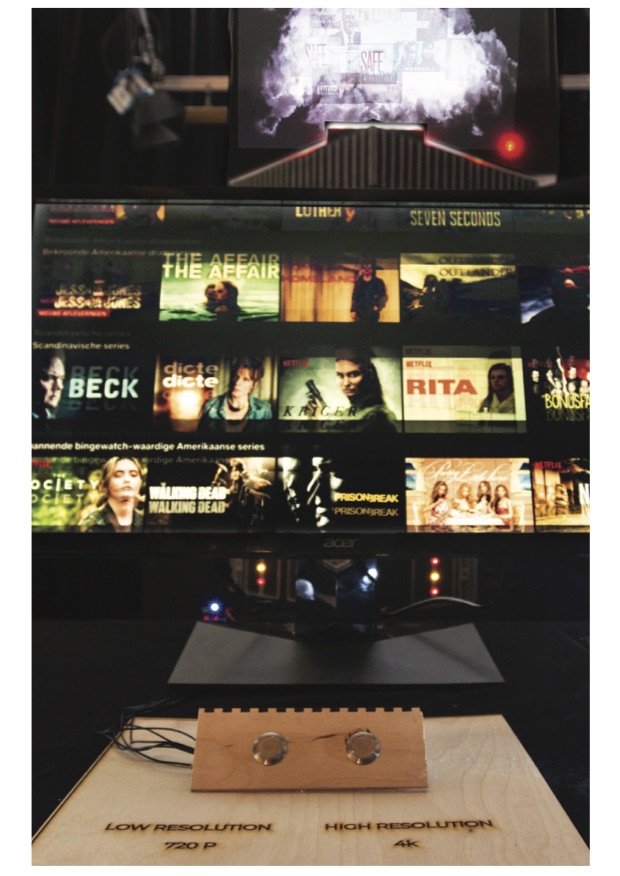
By turning these knobs the intensity of the data consumption and production is altered. For example: producing better (and thus larger pictures) on your phone, increases the need for a larger data stream.
CO2 emissions and climate change caused by data centers is depicted by a “data pit”. The pit is connected to the media platforms mentioned above. When the total data flow increases or decreases it affects a projected “data rain” that rains down on the pit.
Visitors can also look inside the pit, by sticking their head inside the structure. Inside the structure there is a screen that creates the optical illusion of a bottomless pit. By pushing buttons on the side of the installation, different animations are started that confront the visitor with the total CO2 emissions produced by data centers. A stream of hot air is started during the animation that lets visitors feel the produced heat.
By altering the streams of data on the media devices, the total stream of data and thus produced heat and CO2 emissions change. Through this process of experimentation the visitor can learn how their online behaviour affects the system.
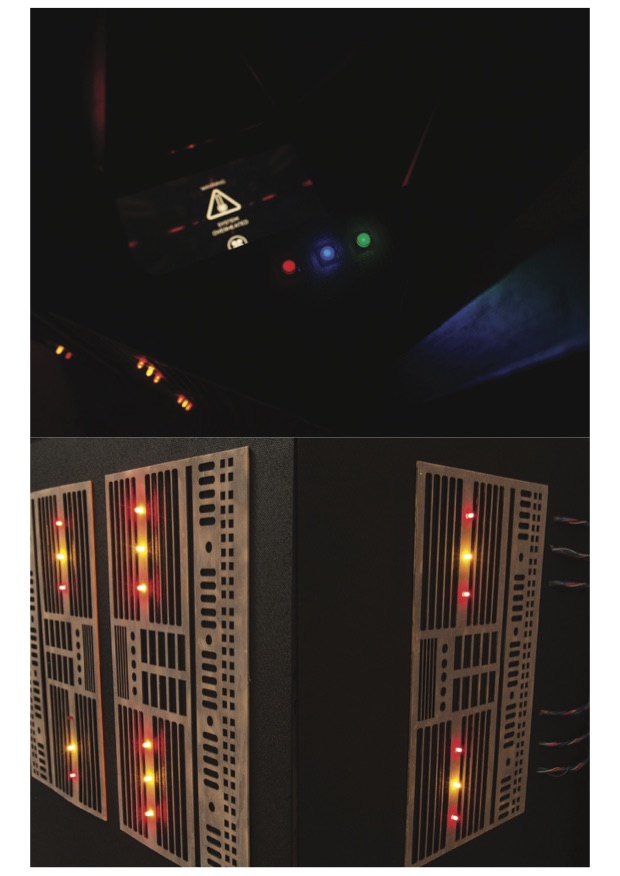
The Daily Data Dump is built using a strong wooden frame and wooden sheets, painted black. A laser cutter was used to create a roster to mount LEDs. Inside of the pit a computer screen is connected to a computer running the animations. An Arduino microcontroller was used to drive all the LEDs and read out the buttons. A beamer (connected to the same computer inside of the structure) projects the data rain above the “pit”.

Acknowledgements
The Daily Data Dump
concept and installation were created by:
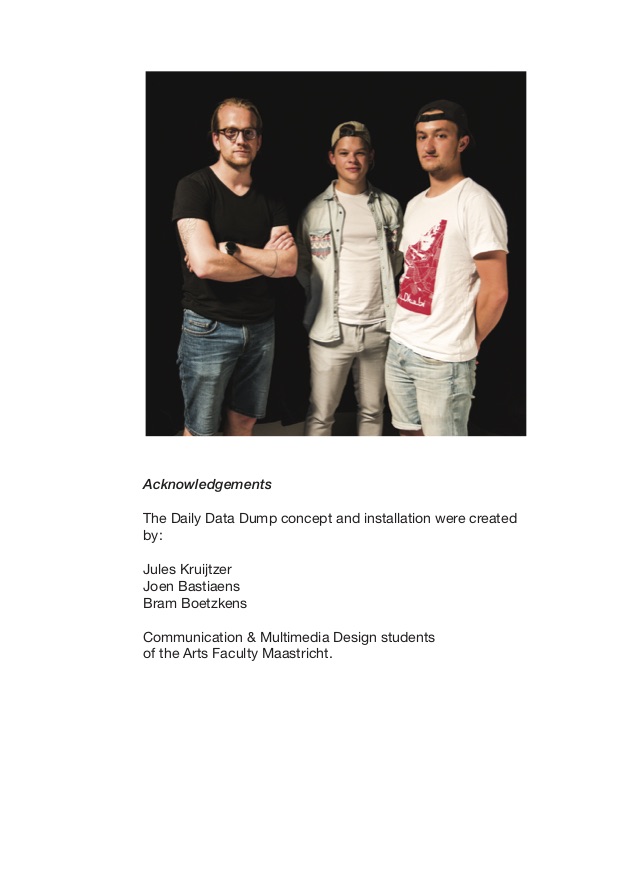
Jules Kruijtzer
Joen Bastiaens
Bram Boetzkens
Communication & Multimedia Design students of the Arts Faculty Maastricht.
Project 2VIEW
Food production
Introduction
Daily choices we make have and effect on the climate system around us. Unfortunately, these effects are only visible on a large scale and longer periods of time. This might give the appearance that our actions are not connected to the larger system. Messages of increased global temperature or the extinction rate of animals might seem unconnected to our own actions.
These systems, however, are more connected than we realise. Food production, for example, is one of the main causes of negative climate change.
Objective
Build an interactive museum installation that educates people on the topic of food consumption and its relation to global climate change.
The installation
VIEW is an interactive installation that can be installed in any restaurant. By projecting on top of the menu and table, it creates a novel and interactive experience that surprises the unsuspecting restaurant visitor.
While ordering their food, the visitors can see a whole ecosystem changing based on their food choices.
By altering their choices and experimenting with cause and effect, they can learn how their actions and choices impact the complex ecosystem that’s projected in front of them.
The installations consists of a beamer mounted above a restaurant table and two little boxes on each side of the table mounted with illuminated buttons. Using these buttons, the visitors can navigate the experience and influence the projected system in front of them.
A mini computer, mounted beneath the table, controls the whole experience. The interface boxes are built with an Arduino microcontroller.
Acknowledgements
The Viewconcept and installation were created by:
Jiska Adriaens
Nina Bisscheroux
Danique Dohmen
Djamal Tehubijuluw
Communication & Multimedia Design students of the Arts Faculty Maastricht.
Project 3
SHARING
The sharing economy
Introduction
What if? What if we would share more? Could this tiny alteration of our behaviour have an effect of the amount of CO2 we emit as a species ? In order to experience the way the whole climate system reacts to seemingly small changes such as a tendency to share, you need to be able to experiment with the different parameters and see their effects on the system as a whole.
Objective
Build an interactive museum installation that educates people on the topic of sharing and its relation to global climate change.
The installation
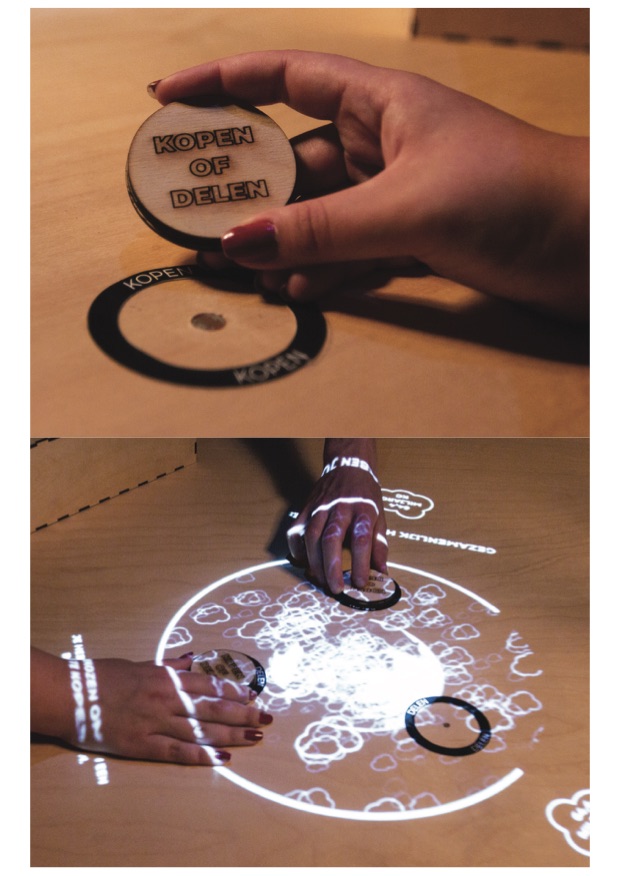
Sharing = caring is an interactive museum installations that enables visitors to explore the effects of sharing on CO2 emissions. It does so by focussing on 3 topics: sharing or owning a car, a drill and a dress. By using these everyday examples of household items that we all own, it delivers a message that’s close to home.
Sharing is caring is a table-top installation that can host 3 visitors. Projected on top of the table-top are scenarios in which the visitors need to make a choice. The choice always involves either sharing or buying an item.
The effects of our own choices, as well as the cumulation of the choices of the other visitors, are directly visualized and displayed in the middle of the table. This enables the 3 visitors to experiment with cause and effect and it opens up room for negotiation. It might be OK for one of the 3 visitors to own something, if the other share, for example. Opening the dialog about ownership and sharing things, and the absurdity of everyone owning the same things while rarely using them is the main objective of this experience.
Sharing=caring consists of a table, a projector, some wooden “pucks”, a computer and an Arduino microcontroller. All visual elements are projected by the beamer on top of the table. By placing the wooden pucks on certain areas of the table, visitors can make choice between sharing or owning a product. A central computer, mounted beneath the table, controls all the processes and (re)calculates the animations. An Arduino microcontroller checks if pucks are placed in a certain slot, and communicates this choice to the main computer.
Acknowledgements
The Sharing
concept and installation were created by:
Marika Patsa
Rob Dormans
Sven Vossen
Mike van Engelen
Communication & Multimedia Design students of the Arts Faculty Maastricht.
All project are part of the minor Interactive Media Installation Design 2018-19 by Rob Delsing and Tom Luyten for MAMDT Zuyd University
With the support of the research group TechnologyDrivenArt.org
©2019